Throughout Equilibrium, you will find several different lists containing potentially pages and pages of data (the longer you use Equilibrium, the more data you’ll accumulate). We present the data to you in a basic format that we feel may be helpful. However, that format is not set in stone. You have the ability to manipulate the data you see and the format in which it’s organized.
There are several options available to you in the sidebar on the left. Use the “Show”, “Grouping”, and “Filters” options to communicate to Equilibrium what types of records you want to show, and how you’d like those records grouped and filtered.

Again, by default we show basic information for each of the records in the list. You can easily add or remove columns based on the data you wish to see. Hover over any of the column headings to expose the drop-down arrow. When you pull the drop-down and hover over the word “Columns” you will see all of the columns available for the list you’re viewing. Add and remove columns checking the appropriate check boxes.
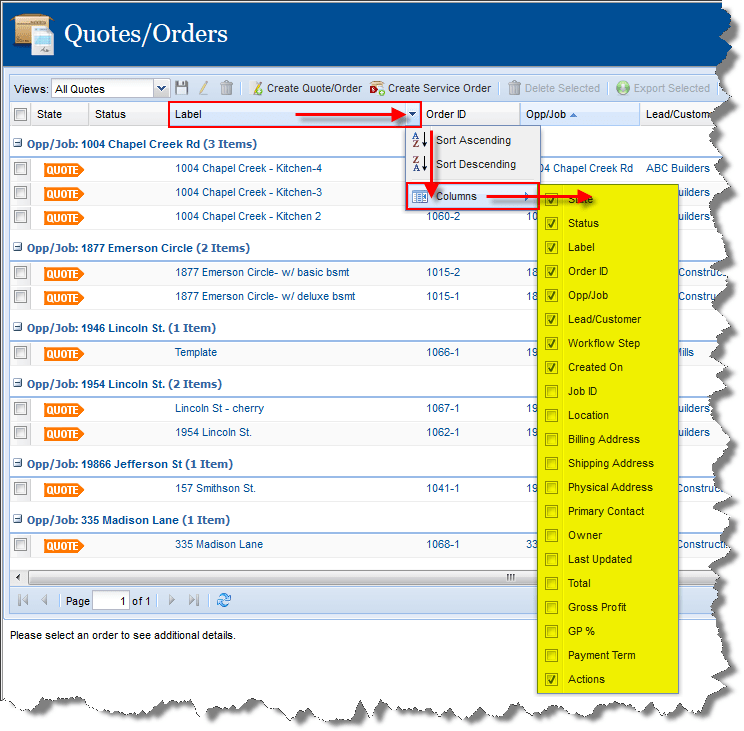
You can even tell Equilibrium that you’d like to sort the data by one particular column in either ascending or descending order. Simply click on that column heading.

If you’re looking for a particular set of data, you can easily filter the records by the columns. Simply click the Filters button in the upper right-hand corner and then check the “Show Filters” box. Doing so will add a filter field for the columns that allow filtering. You can filter by one column or several columns at once.

For additional information on saving the format that you create, see our “Saving Custom Views” post.
